|
|
|
|
|
$600 billion stolen from U.S. taxpayers yearly March 27, 2019
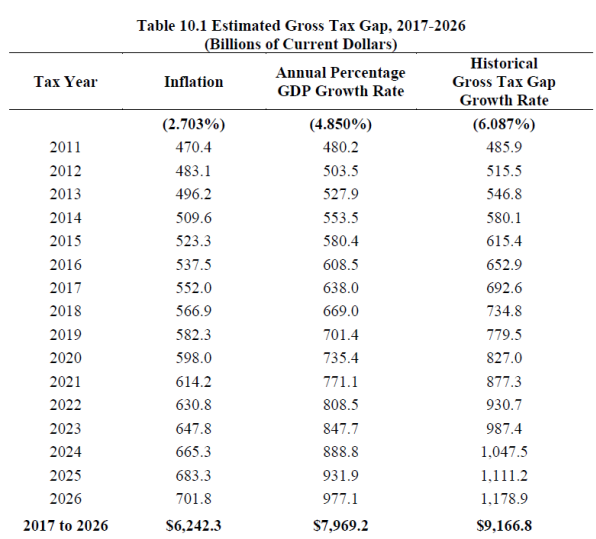
An estimated $600 billion is being stolen from U.S. taxpayers yearly by tax cheaters. To put that amount into perspective, it is almost as much as the $686 U.S. military budget for 2019. (source) Seventy percent of that $600 billion is taken by citizens with incomes in the top 1 percent. (source)
When individuals and corporations don't pay what they legally owe, the rest of us have to make up the difference - or pass the shortfall along to our grandchildren in the form of national debt. The deficit for 2019 is projected to be $1.09 trillion. (source)
Cheaters cheat by under-reporting income or simply failing to file. They get away with it because Congress doesn't give the IRS the funding to aggressively enforce tax laws, and the Trump administration is apparently fine with that. Cheaters no doubt reward them generously in the form of campaign contributions.
It's another way the rich get richer. Since taxes are withheld from their paychecks, wage earners are less likely to get the opportunity to avoid taxes.
Most states - like Michigan - have income taxes that are based on federal adjusted gross income (AGI), so their revenues are also being shorted. In Michigan, the loss could be as high as $1.4 billion. Here's how I calculated it:
"Net compliance rate" is defined by the IRS as the percentage of tax due that is actually collected, and it consists of taxes paid voluntarily plus late payments and taxes collected through enforcement. In tax years 2008-2010, the latest years for which it was calculated, net compliance rate averaged 83.7%. (source) Michigan's individual income tax generated $8.1 billion in net revenue for tax year 2016 (the latest report available) from total reported AGI of $340,468,742,136, which is an effective tax rate of 2.39%. (source, page 10) Using those figures with a 100% compliance rate, an additional $1.4 billion would have been collected:
Of course, 100% compliance will never be achieved, even with full funding of the IRS. That $600 billion a year can't all be recovered. But the IRS can also go after unpaid taxes for past years.
Now that the Democrats have the majority in the U.S. House of Representatives - for the first time since 2011 - they have the opportunity to propose a budget that fully funds the IRS.
I was inspired to write this by a March 22 story in the Tampa Bay Times by business reporter Graham Brink. In an email, I asked him how he came up with the $600 billion figure:
His reply:
Send comments, questions, and tips to stevenrharry@gmail.com, or call or text me at 517-505-2696. If you'd like to be notified by email when I post a new story, let me know.
|
 Public
Policy
Public
Policy